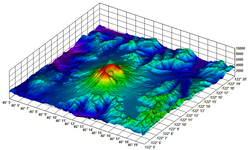
One of the statistical analysis programs I was able to discover and experiment with was data plot. I believe data plot can be very useful and applicable for a measurement and evaluation project I am currently working on. It offers presentation graphics, raw graphics, multivariate, probability conclusions and more. This type of information is a longer and harder process when the proper tools can not be utilized. It also possesses functions such as mean, standard deviation and it also displays graphs in histograms and frequency polygons. What I found to be the coolest feature in the data plot software was the ability to have 3-D visual displays. These visual 3-D visual displays I think could be very valuable for an architect or a person who works with the city landscaping/design. The picture above is just one example of what data plot is capable of.
